- 9.0 Reports & Settings
- 9.1 The Reports Module
- Figure 258 shows the 1CRM screen with the Reports Module selected:
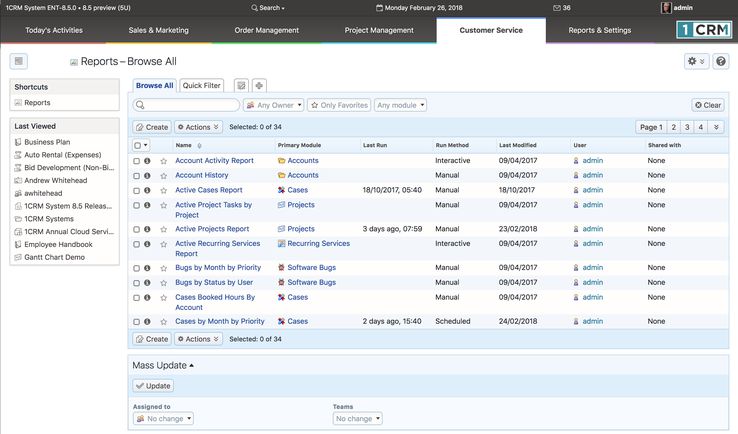
- Figure 258: The Reports Module
- This module is one of the most important within 1CRM – without it you must develop your understanding of the current state of your business using just the list views in each module, and the charts on the dashboard. For a smaller organization this is almost workable, but as businesses get larger and the data becomes more complex, reporting is mandatory, not a nice-to-have feature.
- The list view of the reports module shows a list of available reports. You may click on the name of a report to run that report, or to see the archived results of previous runs of that report. Each report listed shows its name, the principal module on which it reports, when it was last run, when it was last modified, and if it is set to run manually, interactively or automatically.
- A number of predefined standard reports are included with the system, and new report designs may be easily developed and saved for repeated use in future, by clicking on the
 button.
- 9.1.1 Running Standard Reports
- To run a standard report, you need to select it from the reports list view. This shows you the report detail view (see Figure 259), from which you can then run the report by clicking on the
 button. You can also click on the
  button, to view the report edit view, which shows the report name, the primary module from which its data is drawn, and the run method and interval - and allows you to edit the report definition. As well, you can use the
  button to display a popup box with the SQL query language to be used by that report.
- Note: In the Claro and Flex themes, the
 button and the
 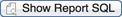 button are no longer buttons, but are options on a settings dropdown control
  .
.
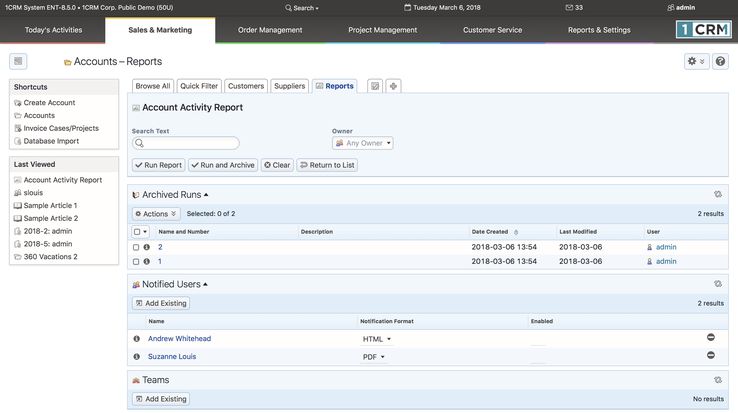
- When you run the report, the results are displayed on the Report Run Details screen, as shown in Figure 260 (unless it is an Interactive type report). When you wish to exit this screen, just click on the
 button, to go back to the report detail view. The data from this run of the report will be archived, and added to the Archived Runs sub-panel on the detail view display. You can also exit the screen by clicking on the
  button, in which case you will still return to the report detail view, but now without the current report data added as a new archived run.
- In the report run details screen, you may page forward and backwards through the detail lines of the latest run of the report. (Remember you can temporarily change the page length if you like!) The Print option on the
 button is used to generate a landscape-mode Acrobat PDF print-image file of the report. The results may also be exported to a CSV file for further analysis in Excel, using the Export option on the
  button. Depending on the specific report, items in the report may also be hyperlinked, enabling you to click on them to view the item’s detail view.
- Archived runs of a report may be viewed at any time by clicking on the hyper-linked run number. Each archived run carries a run date and time, a name, description and assigned user, and may be deleted if desired by clicking on the
 icon.
icon.
- Figure 259: The Report Detail View
- Note: Archived runs of a report can sometimes build up, to the point where you have dozens, or even hundreds of report runs archived. Usually the extreme cases of this happen for Scheduled Reports, where the 1CRM system itself runs the reports automatically on a regular basis. To control this accumulation, 1CRM scheduled reports let you set a value Max. Number of Runs to Keep. Your system administrator controls a scheduler task that periodically checks all scheduled reports, and removes the oldest report runs in excess of the maximum number to be kept. You can also remove them using the Delete Action on the Archived Runs sub-panel of any report.
- Figure 260: Report Run Details
- 9.1.2 Creating New Reports
- There are two ways to define a new report: either click on the
 button on Reports list view and choose a module from a popup menu; or go to the list view of the module you want to report on, click on the Reports layout tab (see Figure 260 for example), and then click on the layout tab labelled ✚. Either approach gets you into the Report Editor editing a new report, based on the desired module (see Figure 261). Choose a name for the report, and enter a Description.
- Next, choose the Run Method and (for Scheduled Reports only) the Next Run date and time and Run Interval.
- If the report will only be run manually as required, then set the Run Method to Manual.
- Set the Run Method to Interactive if you wish the report to be run like a manual report, but with the ability to set report filter values interactively as the report is generated.
- If you wish the report to be run automatically at regular intervals, then set it to Scheduled, set the Next Run date to the first time you’d like it to be run, and the Run Interval to the number of Days, Weeks, Months, Quarters or Years desired between runs. Also set the Max. Number of Runs to Keep as desired.
- Note: Scheduled reports will not be run unless the Scheduler is setup properly by the Administrator.
- The Primary Module on which the report is to be based will be pre-set, but you can optionally choose one or more Related Sources, such as Contacts and Meetings as shown related to the Accounts module in Figure 261. Once you have done that, you can proceed to the other Report Editor tabs.
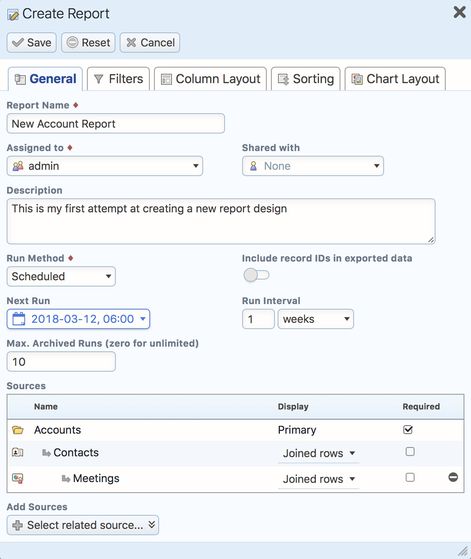
- Figure 261: Editing a New Report - General Tab
- 9.1.3 Setting Report Filters
- Clicking on the Filters tab will reveal a screen much like that in Figure 262. Note that in this Figure we have checked Non-Zero Balance Only - so that the report only shows us Accounts that owe us money. And we have defined a Filter Group (by clicking on the
 button), and set it to group the filters together using Any Of logic, and then added the Country field to it twice using the
  button, looking for Canada in one instance of the filter, and USA in the other.
- This will have the effect of only listing Accounts in Canada or the USA, that also owe us money.
- The Filter Group logic options are:
- All Of: All the conditions indented under the Group must be true
- Any Of: Some of the conditions indented under the Group must be true
- None Of: None of the conditions indented under the Group may be true
- Not All Of: Not all of the conditions indented under the Group may be true (so if some or none of them are true, that’s fine)
- Note: Use the
 control to drag a filter left and right, to indent it under a filter group, or un-indent it from one.
- Note: The Hide checkmark is used only for Interactive reports. It allows you to define a filter for an Interactive report, but not to expose that filter to the user during the interactive session as they adjust filter values.
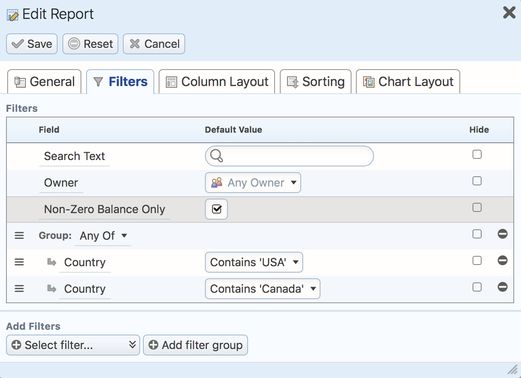
- Figure 262: Editing a New Report - Filters Tab
- 9.1.4 Defining your Report’s Column Layout
- Next, click on the Column Layout tab. As in the Figure below, you should see a list of field names, with each entry also showing the field type, a width allowance for the field, and a few other values. The order of these fields from top to bottom represents what you will see on the screen, and in any PDF you generate, from left to right. Some key points on operating this tab are:
- Any field with the Hide checkmark set will be used in the creation of the report, but will not be shown on screen or in the PDF.
- To remove any field, just click on the
 icon to the far right.
- To make any field wider on screen and on the PDF, increase the Width value (Max. 50).
- You can space out your columns by adding empty columns as fields, with the
 button.
- Add Totals to your PDF (not shown on screen) with the
 button.
- To reorder fields, use the
 control to drag fields up and down.
- You can add new fields with the
 button. Clicking on it will present you with a long scrolling list of fields, also showing the field types.
- Click on the
 icon to the right of any field, and select the dropdown Make Grouped option to convert this to a Grouped Field.
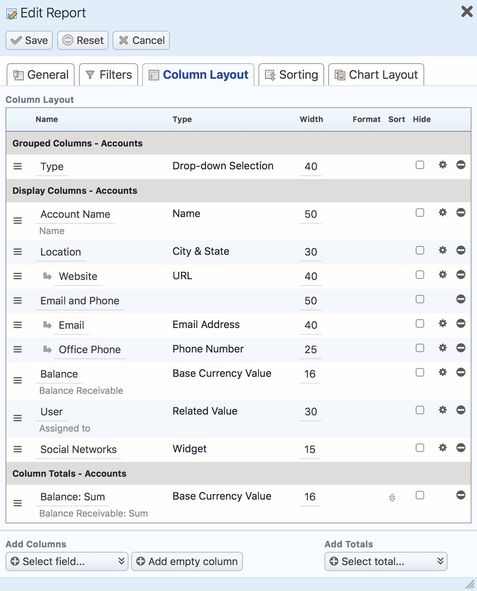
- Figure 263: Editing a New Report - Column Layout Tab
- Additionally, note that:
- If you click on the underlined name of any field, you will be prompted to enter a new name, which will be used on the screen and for the PDF. You can also reset the name to its default.
- If you select a date, date/time or currency field, you will also need to select the preferred format for that field in the Format column, using a Format dropdown control.
- Date fields may be formatted to show just the Month, Quarter, Year, Year & Month, Fiscal Quarter, or Fiscal Year. Date & Time fields offer the additional options of Date only or Time only. Fields like this may be added to the field list more than once, in multiple data formats. So – a date could be added as the Fiscal Quarter it belongs to – so it can be used to group data by fiscal quarter – but also as the original date value so it can be displayed.
- A currency field may be formatted as Standard, Rounded (no decimal places), In Thousands ($425,500.07 is shown as $426K), or In Millions ($425,500.07 is shown as $0.4M).
- The Column Layout tab displays three types of columns (fields), with a sub-heading for each:
- Grouped Columns – These fields are used to group data in the report. One could group accounts by the account type, as above, or contacts by category, or invoices by the month in which they are due. Grouped columns will organise the screen report by the specified field, and will produce a PDF with sub-heading titles for each new value for the grouped field
- Display Columns – These fields will be visible in the on-screen report data, as well as in the PDF version of the report, and they are also included in any exported data. The exception to this is fields marked Hide.
- Column Totals – Totals are added by clicking on the
 button to the bottom right. Clicking on it will present you with a long scrolling list of fields, also showing the field types. Entries show the field and mathematical function desired (such as Balance: Sum – which would let you sum the balances of all accounts). Select the combination of field and mathematical function (Count, Min, Max, Sum, Avg, StdDev) you want, to generate functions on this field for all records in the report.
These calculated values are shown at the end of any PDFs generated. Not all field types offer Totals – they are available as follows:
- No Totals: Text, Multi-Line Text, True or False, Dropdown, Phone Number, Email Address, Related Value, and User Name fields.
- Count: Name fields.
- Min, Max: Date, Date & Time fields.
- Sum, Avg, Min, Max: Currency fields.
- Sum, Avg, Min, Max, StdDev: Integer, Number, Real Number fields.
- 9.1.5 Report Sorting
- As you may see in the Figure below, reports may easily be sorted by selecting a field on which to sort, and then choosing Ascending or Descending sort order. If you define multiple sort fields, the first will be the primary sort field, the next the secondary, and so on.
- To reorder sort fields, use the
 control to drag fields up and down.
- To remove a sort field, just click on the
 icon to the far right.
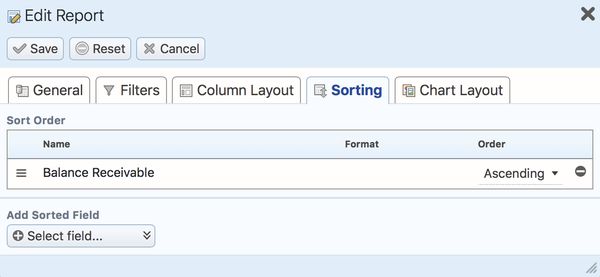
- Figure 264: Editing a New Report - Sorting Tab
- 9.1.6 Defining your Report’s Chart Layout
- Charts may be created from any report, providing that the report has at least one reported field whose display type is set to Grouped, and add at least one total. Once these conditions are met, the Chart Layout tab allows you to select a Chart Type (Horizontal Bar Chart, Vertical Bar Chart, Pie Chart, Line Graph or Area Chart), and a Data Series (from all chartable data series available). You may also enter a Chart Title, Rollover Text and Chart Description.
- Once a chart has been defined, the next time the report is run, a chart will be generated as part of the report. As well, the chart will be made available in the list of chart dashlets which may be added to the dashboard.
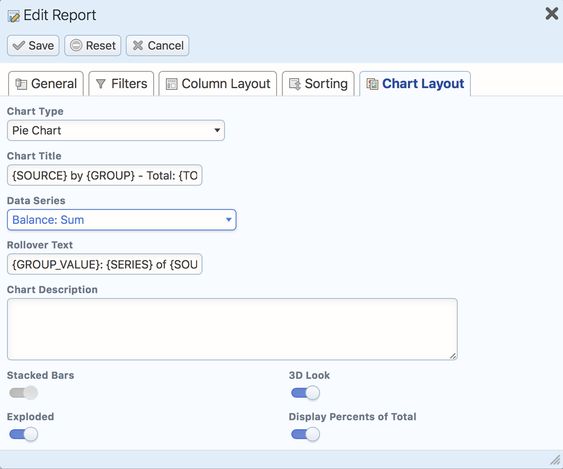
- Figure 265: Editing a New Report - Chart Layout Tab
- 9.1.7 Working with Related Sources
- To create a report that relates data in one module (table in database terms) to data in another module, or includes data from more than one module, just create a report normally from the list view of your most important module in the report. The Primary Module of the report will be pre-set, but you can also optionally choose one or more Related Sources, such as Contacts and Meetings as shown related to the Accounts module in Figure 261.
- Now when you click on the
 or
or  buttons, you will see a dropdown list that requires you to select the module from which to choose a field.
- The best way to understand these more complex reports is to study the pre-programmed reports included with the system. Look for reports with titles like Contacts by Account – any report that mentions two tables in its name.
- 9.1.8 Specialized Reports
- Several of the standard reports that are provided with 1CRM are not actually created by the normal report designer described above, but are custom coded in the report template format that is produced by the report designer. This is because the 1CRM report generator is capable of producing many reports which cannot actually be described through the use of the report designer.
- The limitations of the report designer are intentional, to create a user interface that is more approachable by most users. But to take full advantage of the report generator’s capabilities, coding a report manually, directly into the report template format, is a powerful option available to software developers customizing or extending an 1CRM implementation.
- Some of these specialized hand-coded reports included with 1CRM are:
- Project Profitability: This report details Project profitability month by month, with totals summed on the PDF. Filters for project status and start date let you focus on the projects desired. Principal fields are Account, Project Name, expected revenue, cost and profit, and actual revenue, cost and profit.
- Gross Profit by Invoice Range by User: This report details Gross Profit generated for each invoice, with totals summed on the PDF. Filters for invoice creation date and invoice number let you focus on the invoices desired. Principal fields are invoice number and name, invoice date, Account, invoice amount, gross profit and assigned user.
- Sales Tax Collected by Invoice Range by User: This report details the sales tax collected by invoice, with totals summed on the PDF. Filters for invoice creation date and invoice number let you focus on the invoices desired. Principal fields are invoice number and name, invoice date, Account, Tax name and amount, invoice amount and assigned user.
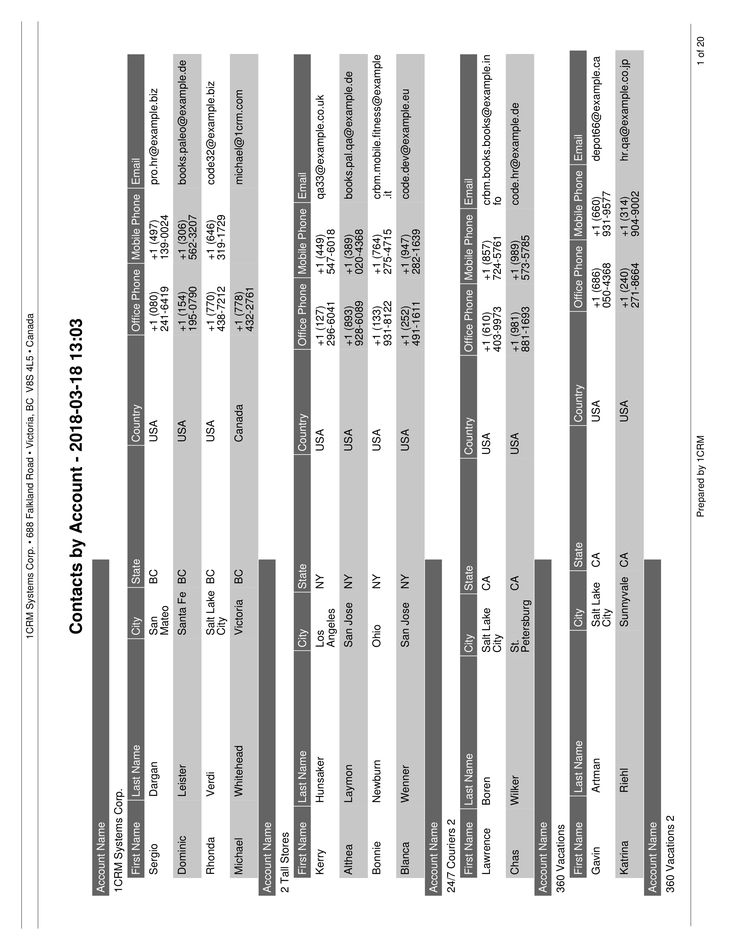
- Figure 266: Sample Report PDF
- 9.2 The Dashboards Module
- Figure 267 shows the 1CRM screen with the Dashboard Module selected:
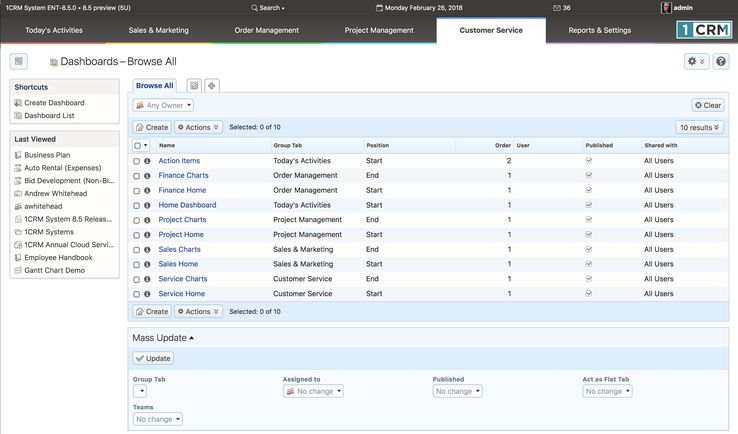
- Figure 267: The Dashboards Module
- The Dashboards module lists the dashboards defined within your 1CRM System. Each dashboard may be viewed or edited from this list view of the various dashboards in your system. The Figure above shows the default dashboards defined in each system. New dashboards may be created using the Create Dashboard shortcut.
- By default, each 1CRM installation has two dashboard pages in the Today’s Activities tab group - the Home Dashboard and Action Items. In most of the other tab groups (Sales & Marketing, Order Management, Project Management and Customer Service) there are also two dashboards by default. Sales & Marketing has a Sales Home dashboard and a Sales Charts dashboard, for example. Sales Home is at the start of the tab group, and Sales Charts is at the end, and the same sort of arrangement exists for the other tab groups mentioned.
- Each dashboard page has basic dashboard information defined for it, as well as a layout. The dashboard info may be set by using the Dashboards module, or by clicking on the Edit button at the top of any dashboard page (see Figure above), and choosing the Edit Dashboard Info option from the four options presented. Once you do this, the following screen will be displayed:
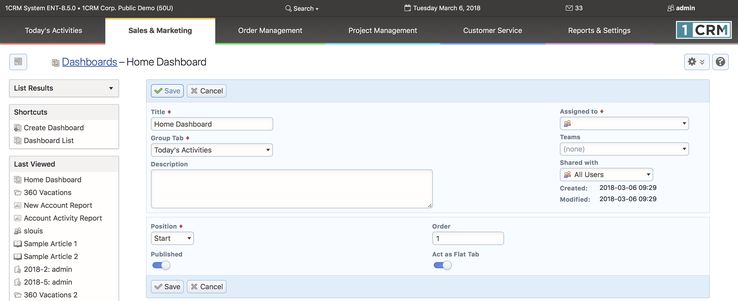
- Figure 268: Setting Dashboard Information
- On the Figure above, you can enter a new Name for the dashboard, choose the Group Tab in which it is to appear, and the position (Start or End) within that Group Tab. The Order value is used if for example 2 or 3 dashboards are defined as going at the Start of the same Tab Group. The Published checkbox controls if the dashboard is displayed or not. And Act as a Flat Tab controls if the dashboard is to be displayed when a theme is in use that either does not offer tab groups, or has been set to simple Modules navigation, not Grouped Modules.
- For more information on editing dashboard content and layout, and about the variety of dashlets available within 1CRM, please see Section 4.1: The Home Dashboard.
- 9.3 The Activity Log Module
- Figure 269 shows the 1CRM screen with the Activity Log Module selected:
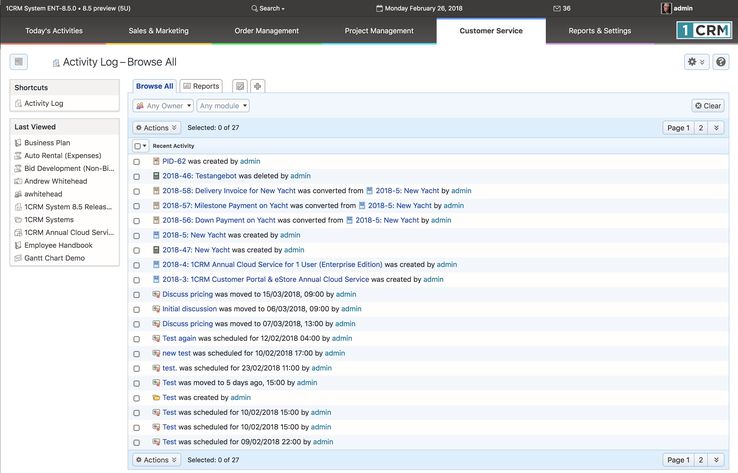
- Figure 269: The Activity Log Module
- The Activity Log module provides the ability to see what users (predominantly, those in Sales) are doing within 1CRM. When Users create a new item in any of these modules - Accounts, Contacts, Leads, Cases, Tasks, Calls, Meetings, Opportunities, Projects, Bugs, Quotes, Sales Orders, Invoices and Payments - a record of that action is added in the Activity Log module.
- The Activity log also tracks when Opportunities are converted to Quotes, Quotes to Sales Orders, and Sales Orders to Invoices. As well, when Opportunities are Won or Lost, Meetings or Calls are re-scheduled (Moved), when Invoices are Cancelled, and when several types of items are Closed or Re-opened, the system will note that Activity.
- When you design Reports, or Custom List View tabs in this module, you can filter by user, or by the module affected, and really see what’s going on within the system.
- There is also an Activity Log dashlet provided, which allows you to access the same type of information within a dashboard layout.
- This module is useful as a guide to where you do and do not have any issues regarding adoption of the system. It can also be a guide to which sales people are the most and least busy!
- 9.4 The System Bulletins Module
- Figure 270 shows the 1CRM screen with the System Bulletins Module detail view displayed:
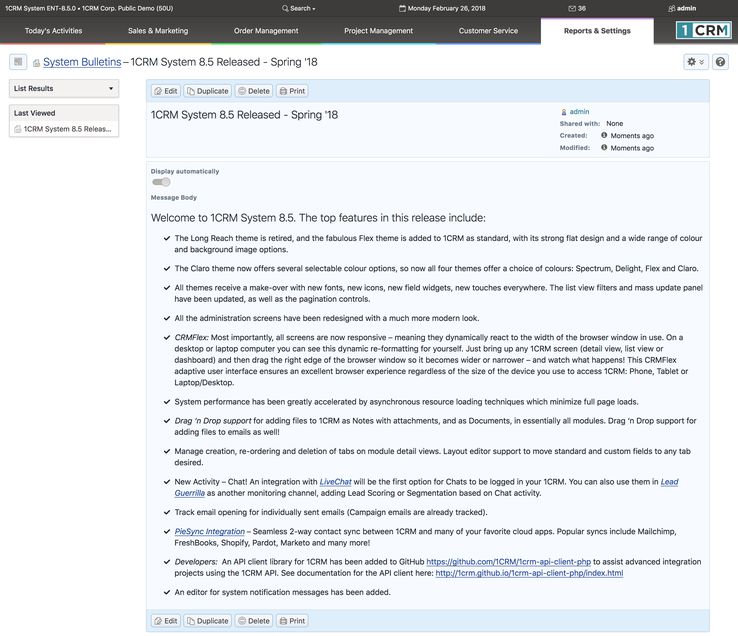
- Figure 270: The System Bulletins Detail View
- The System Bulletins module is used to post news messages to all system users about things such as system upgrades, planned outages, or any other news items that concern the 1CRM system. A dashlet is provided to make these messages easily visible, and you can prepare these messages using the module itself.
- The checkbox Display automatically on any message will cause that message to be shown as a popup to each user with whom the message is shared, after their next login.
- The Shared with dropdown on each message lets you choose if the message is to be shared with All Users, the members of Selected Teams, or None.
- 9.5 The Data Privacy Module
- Figure 271 shows the 1CRM screen with the Data Privacy Module list view displayed:
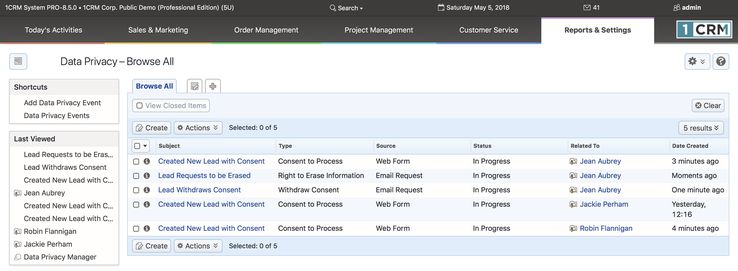
- Figure 271: The Data Privacy Activities List View
- This module is used to manage all 1CRM Data Privacy Activities. These include Request to View, Right to Erase, Consent to Process and Withdrawal of Consent. See more details in the 1CRM and GDPR document.
- Note: Most users cannot access this module. To use this module a user must be added to the special Data Privacy Manager Role by the system administrator.